LITESPD
LITESPD is a MESDAQ company dealing with E-learning.
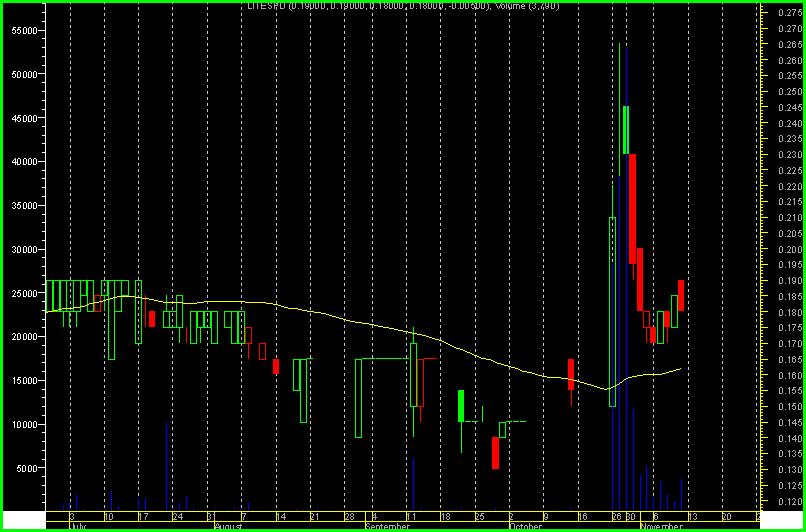
Technically speaking, the stock price just break up from a resistance with a long white candle with high volume. Judging from price and volume action alone, the stock now is in the first wave of up trending. The subsequent price fall after the long candles should be viewed as a healthy retracement by profit taking. Buy recommendation is issued because it is speculated that the price is now meeting a strong support line from the breakout.
It is very common for savvy traders to argue that the two suspicious breakout candles could be a whipsaw signal by manipulators to distribute the stock of the company. However, i found that the abnormal price and volume action started after the release of the quarterly report, which the company reported a positive EPS. The company suffered from some consecutive negative earnings since it was listed in MESDAQ in 2005. It is thus speculated again that the price and volume reactions was probably not resulted from signal manipulation, instead from the release of news. News built momentum, particularly unexpected news.
As a well-known facts, neither technical, fundamental or any hybrid strategies can predict the price movement of any single stock. Should the stock suffer from any irrational exuberance or unexpected event, traders who follow the recommendation should cut loss at their planned price level.
Happy investing and wish you a profitable trade with LITESPD.
4 comments:
Woi... where s all the indicators. Hiding ar? :P
Anyway, after the fall, this stock looks like in accumulation phase.
But time frame is difficult to judge as accumulation could take days, weeks, months or extreme cases - years.
Futhermore, it is sitting near its EMA20 & 50, which suggest that if accumulation phase is judged correctly, then the risk is minimised to an extent.
First key resistance expected to be 21c - previous breakout. However, judging from the limited history of the stock (listed only Nov 2005) this stock has yet to prove anything worth the excitement. So, much is needed to convince other parties to jump in. Hence patience may be required to fish this stock.
Another note is the MFI has been steadily increasing in the last 3 days. This may suggest the upward movement would come soon. Though MFI alone is not conclusive.
Conclusion:
BUY with view for 2-3 months term.
(not really my style :P). Apply stop loss 0.13 (Elder)
Disclaimer - dont shoot me if market does not move in the manner I anticipated. In any case, I m not tracking this stock - neither am I buying or accummulating this stock (reason being this stock does not fit to my trading style and trading portfolio).
Just giving my 2c as a show of support to booffett.
To answer your question, i never like to use indicators. I never believe in mathematical formulas to predict any of the stock movement (however, i never deny the need of math indicators for those who want extra emotional control with fixed rules). I invest in familiarity, the more familiar i am with the chart, and able to explain the actions with fundamental, psychological and upcoming events, then i speculate on the stock.
Huh no indicators?
So you re just using candlestick and patterns (if any)?
When Steve Nison publish his book on candlestick, people in the West have barely heard of it.
The Japanese has already incorporated the Western technicals with their candlestick.
Simplicity is one thing.
Lack of indicators to forewarn us is another thing
Post a Comment